Popularity score
15
estimated players
estimated active players
Stats
27.2
average achievements
33.6h
average total playtime
5.5h
median total playtime
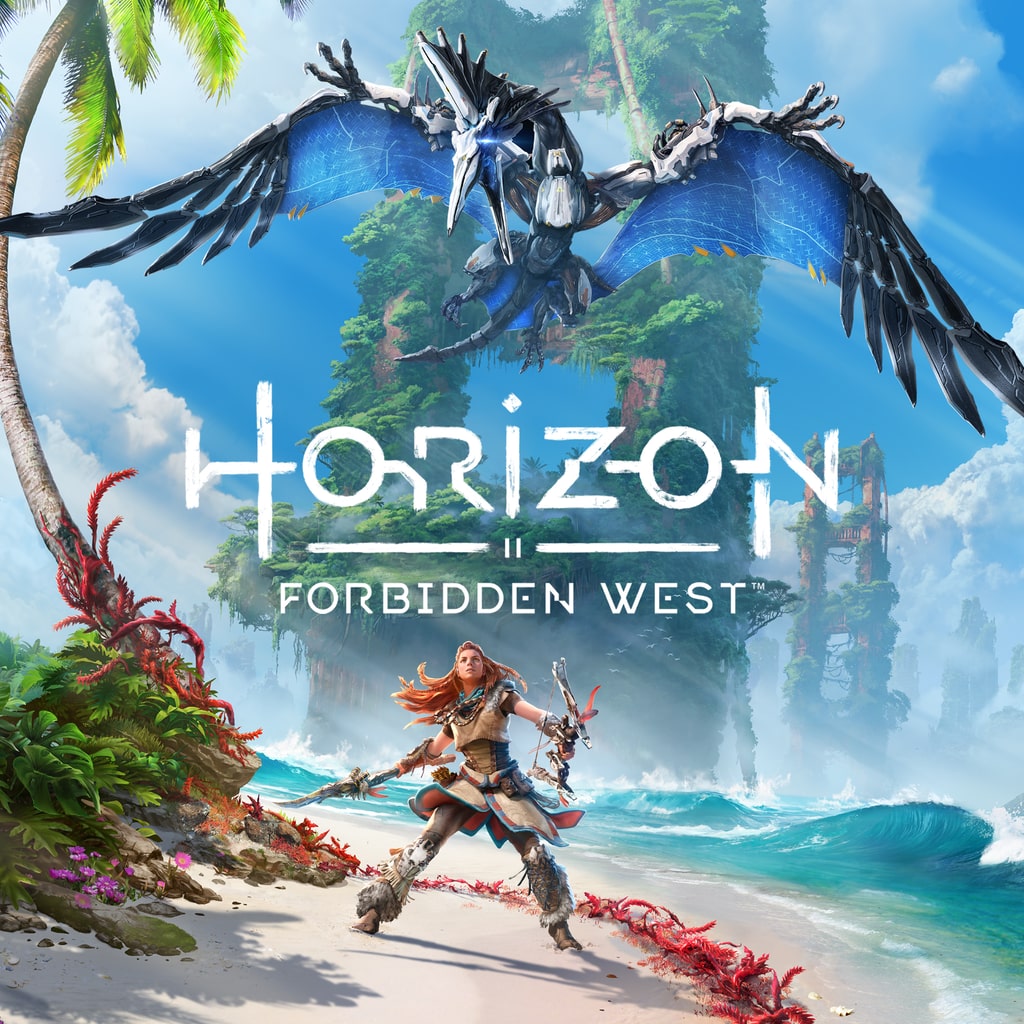
About game
Show more
Release date
2022.02.18. (Original)
Genre
Role-playing (RPG)AdventureDeveloper
Guerrilla GamesPorting
Nixxes SoftwarePublisher
Sony Interactive EntertainmentEngine
DecimaMode
Single PlayerPerspective
Third PersonTheme
Science FictionOpen WorldActionMore tags
NarrativeImmersiveStory RichCombatStylizedFemale ProtagonistCinematicArcheryResource ManagementCraftingExplorationPost-apocalypticRobots
Platform ID
NPWR21008_00
PPSA01521_00


Looking to track your own stats?
Create a PlayTracker account for free, link your other accounts like PlayStation, and track your achievements, playtime, and stats in Horizon Forbidden West and all other games you play!
Lens audience segmentation
Yearly achievement activity
Monthly achievement activity
Purchase a premium subscription to get access to this graph and more.
New users over time
Purchase a premium subscription to get access to this graph and more.
User interaction
User personalities
Veteran Collector
Has a huge library of games.
75% personality strength
Opposite personality: Fresh Recruit
Opposite personality: Fresh Recruit
Indie Connoisseur
Seeks out niche titles.
68% personality strength
Opposite personality: Zeitgeist Enjoyer
Opposite personality: Zeitgeist Enjoyer
Determined Completionist
Hunts diligently for achievements.
63% personality strength
Opposite personality: Wandering Dabbler
Opposite personality: Wandering Dabbler
Niche Dweller
Sticks to a specific type of game.
58% personality strength
Opposite personality: Genre Nomad
Opposite personality: Genre Nomad
Playtime distribution
Purchase a premium subscription to get access to this graph and more.