Popularity score
13
estimated players
estimated active players
Stats
9.5
average achievements
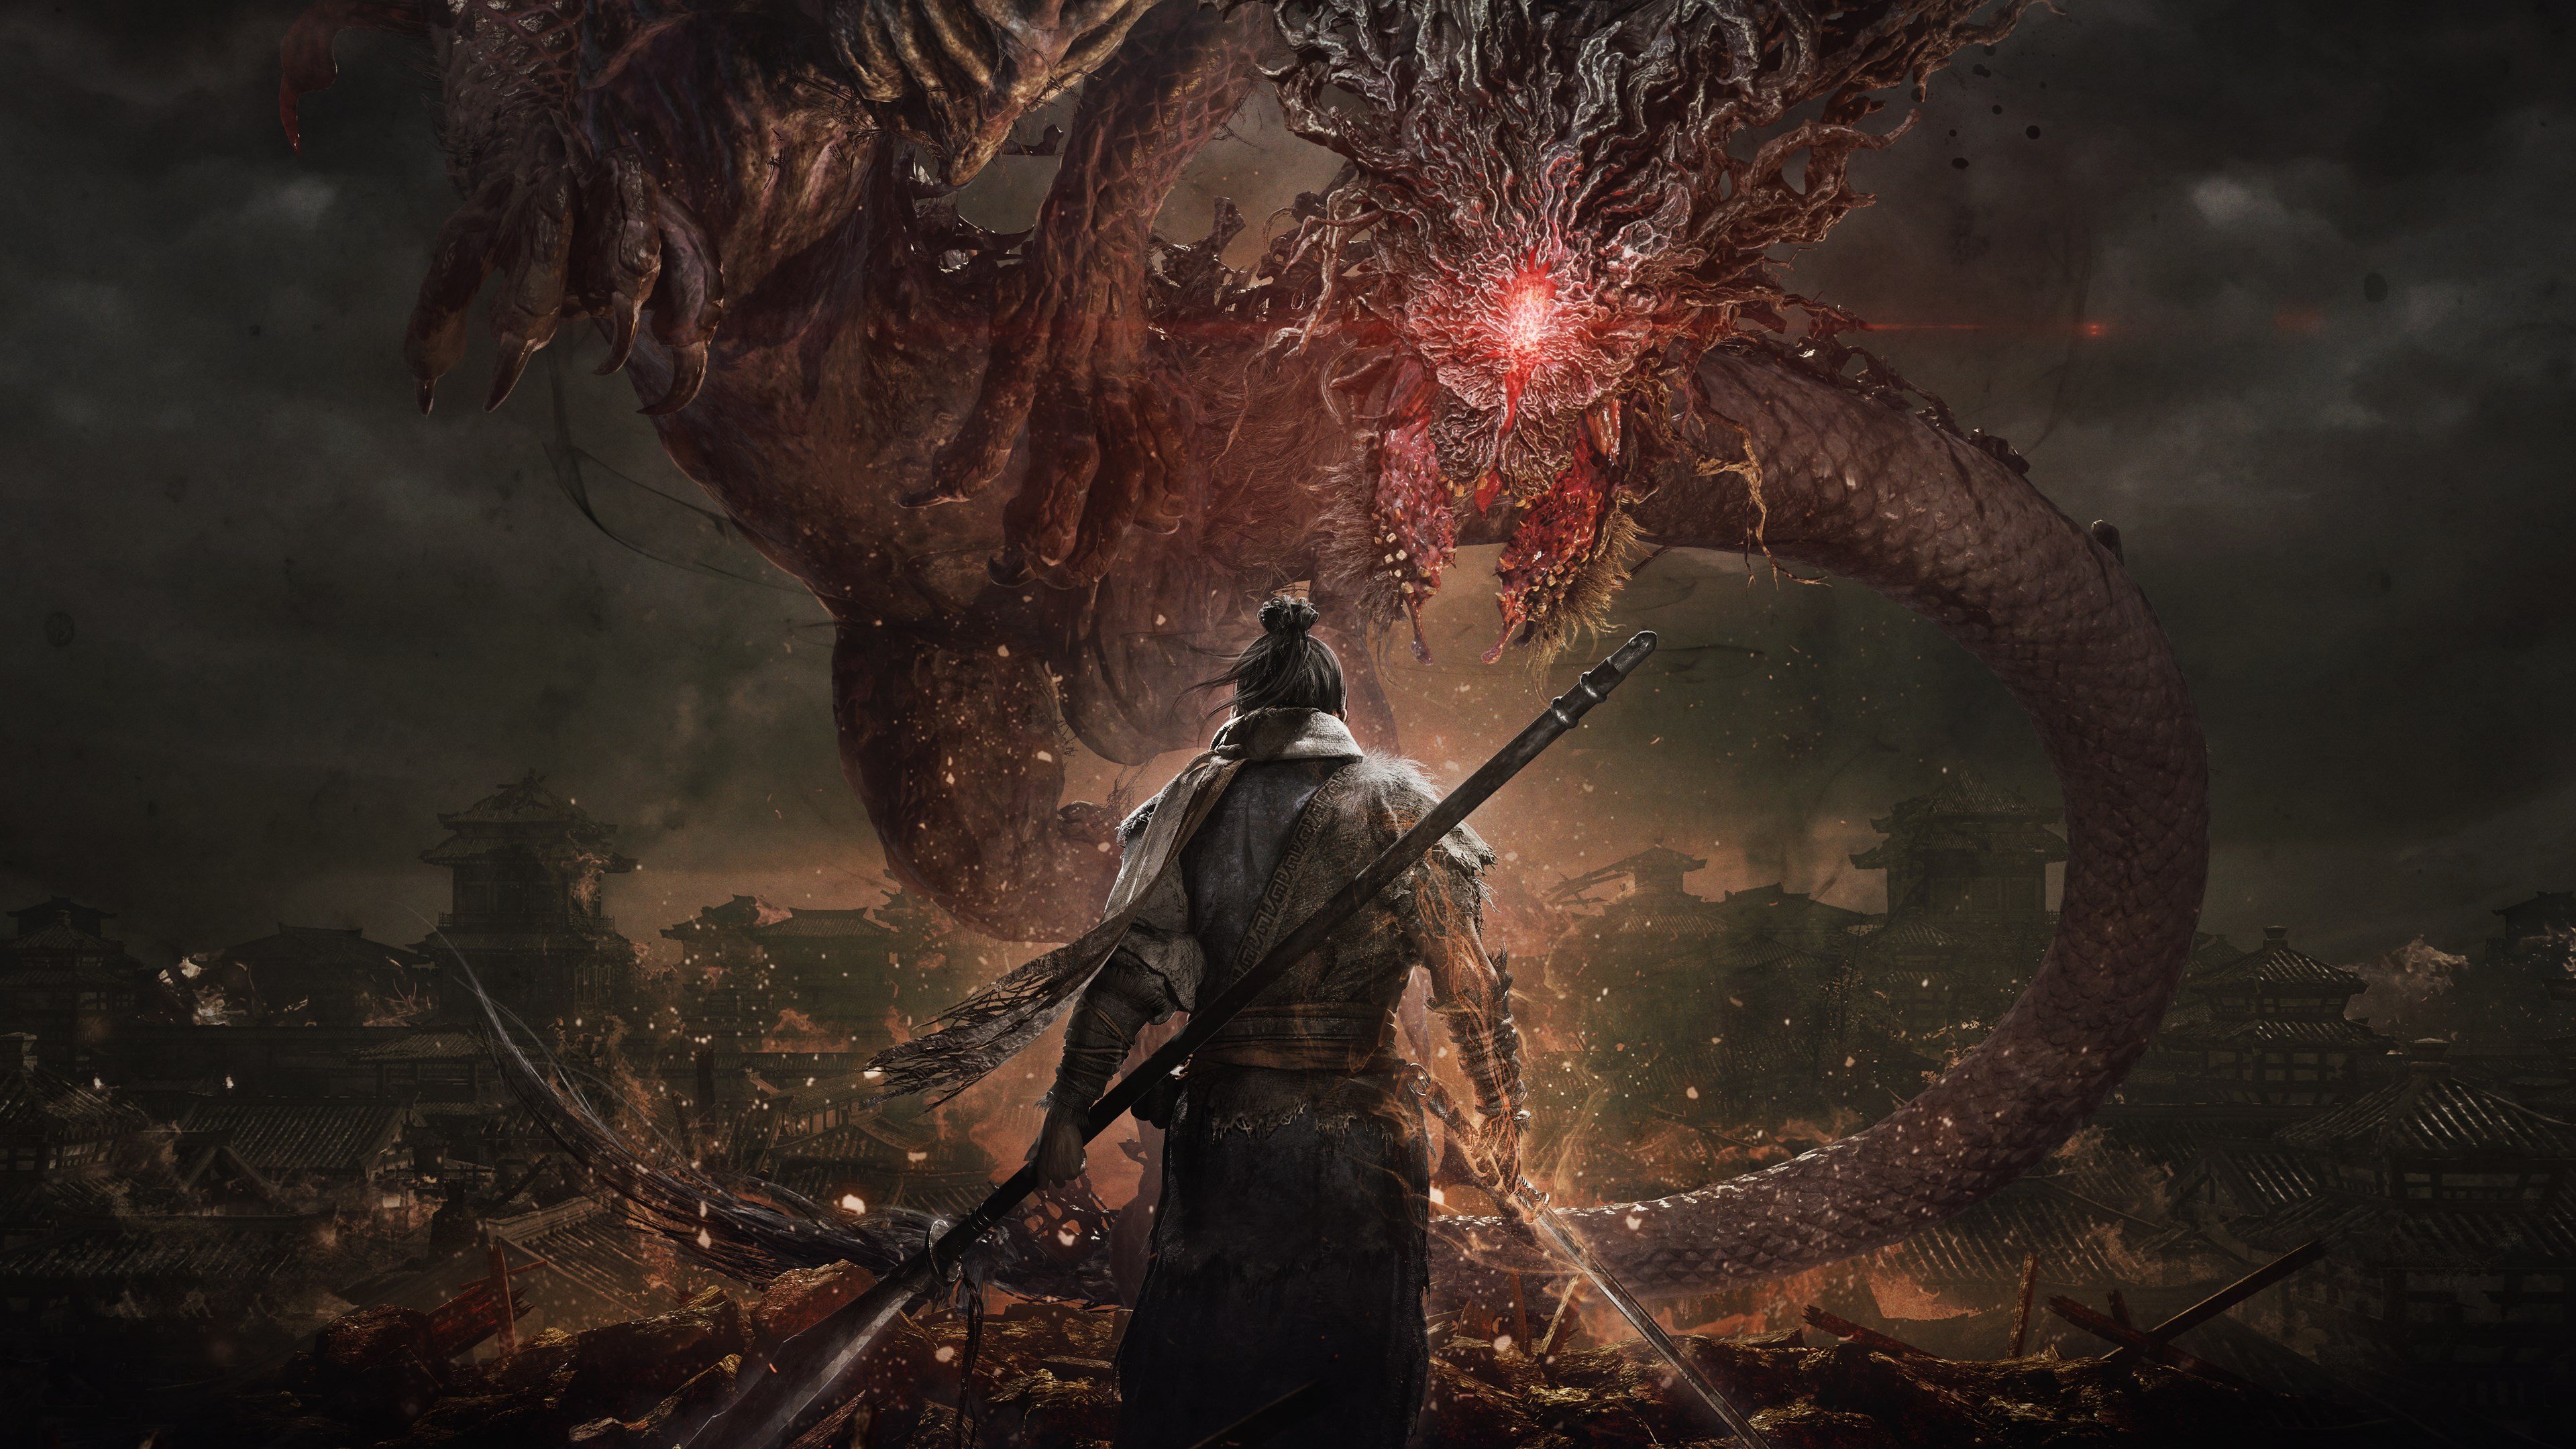
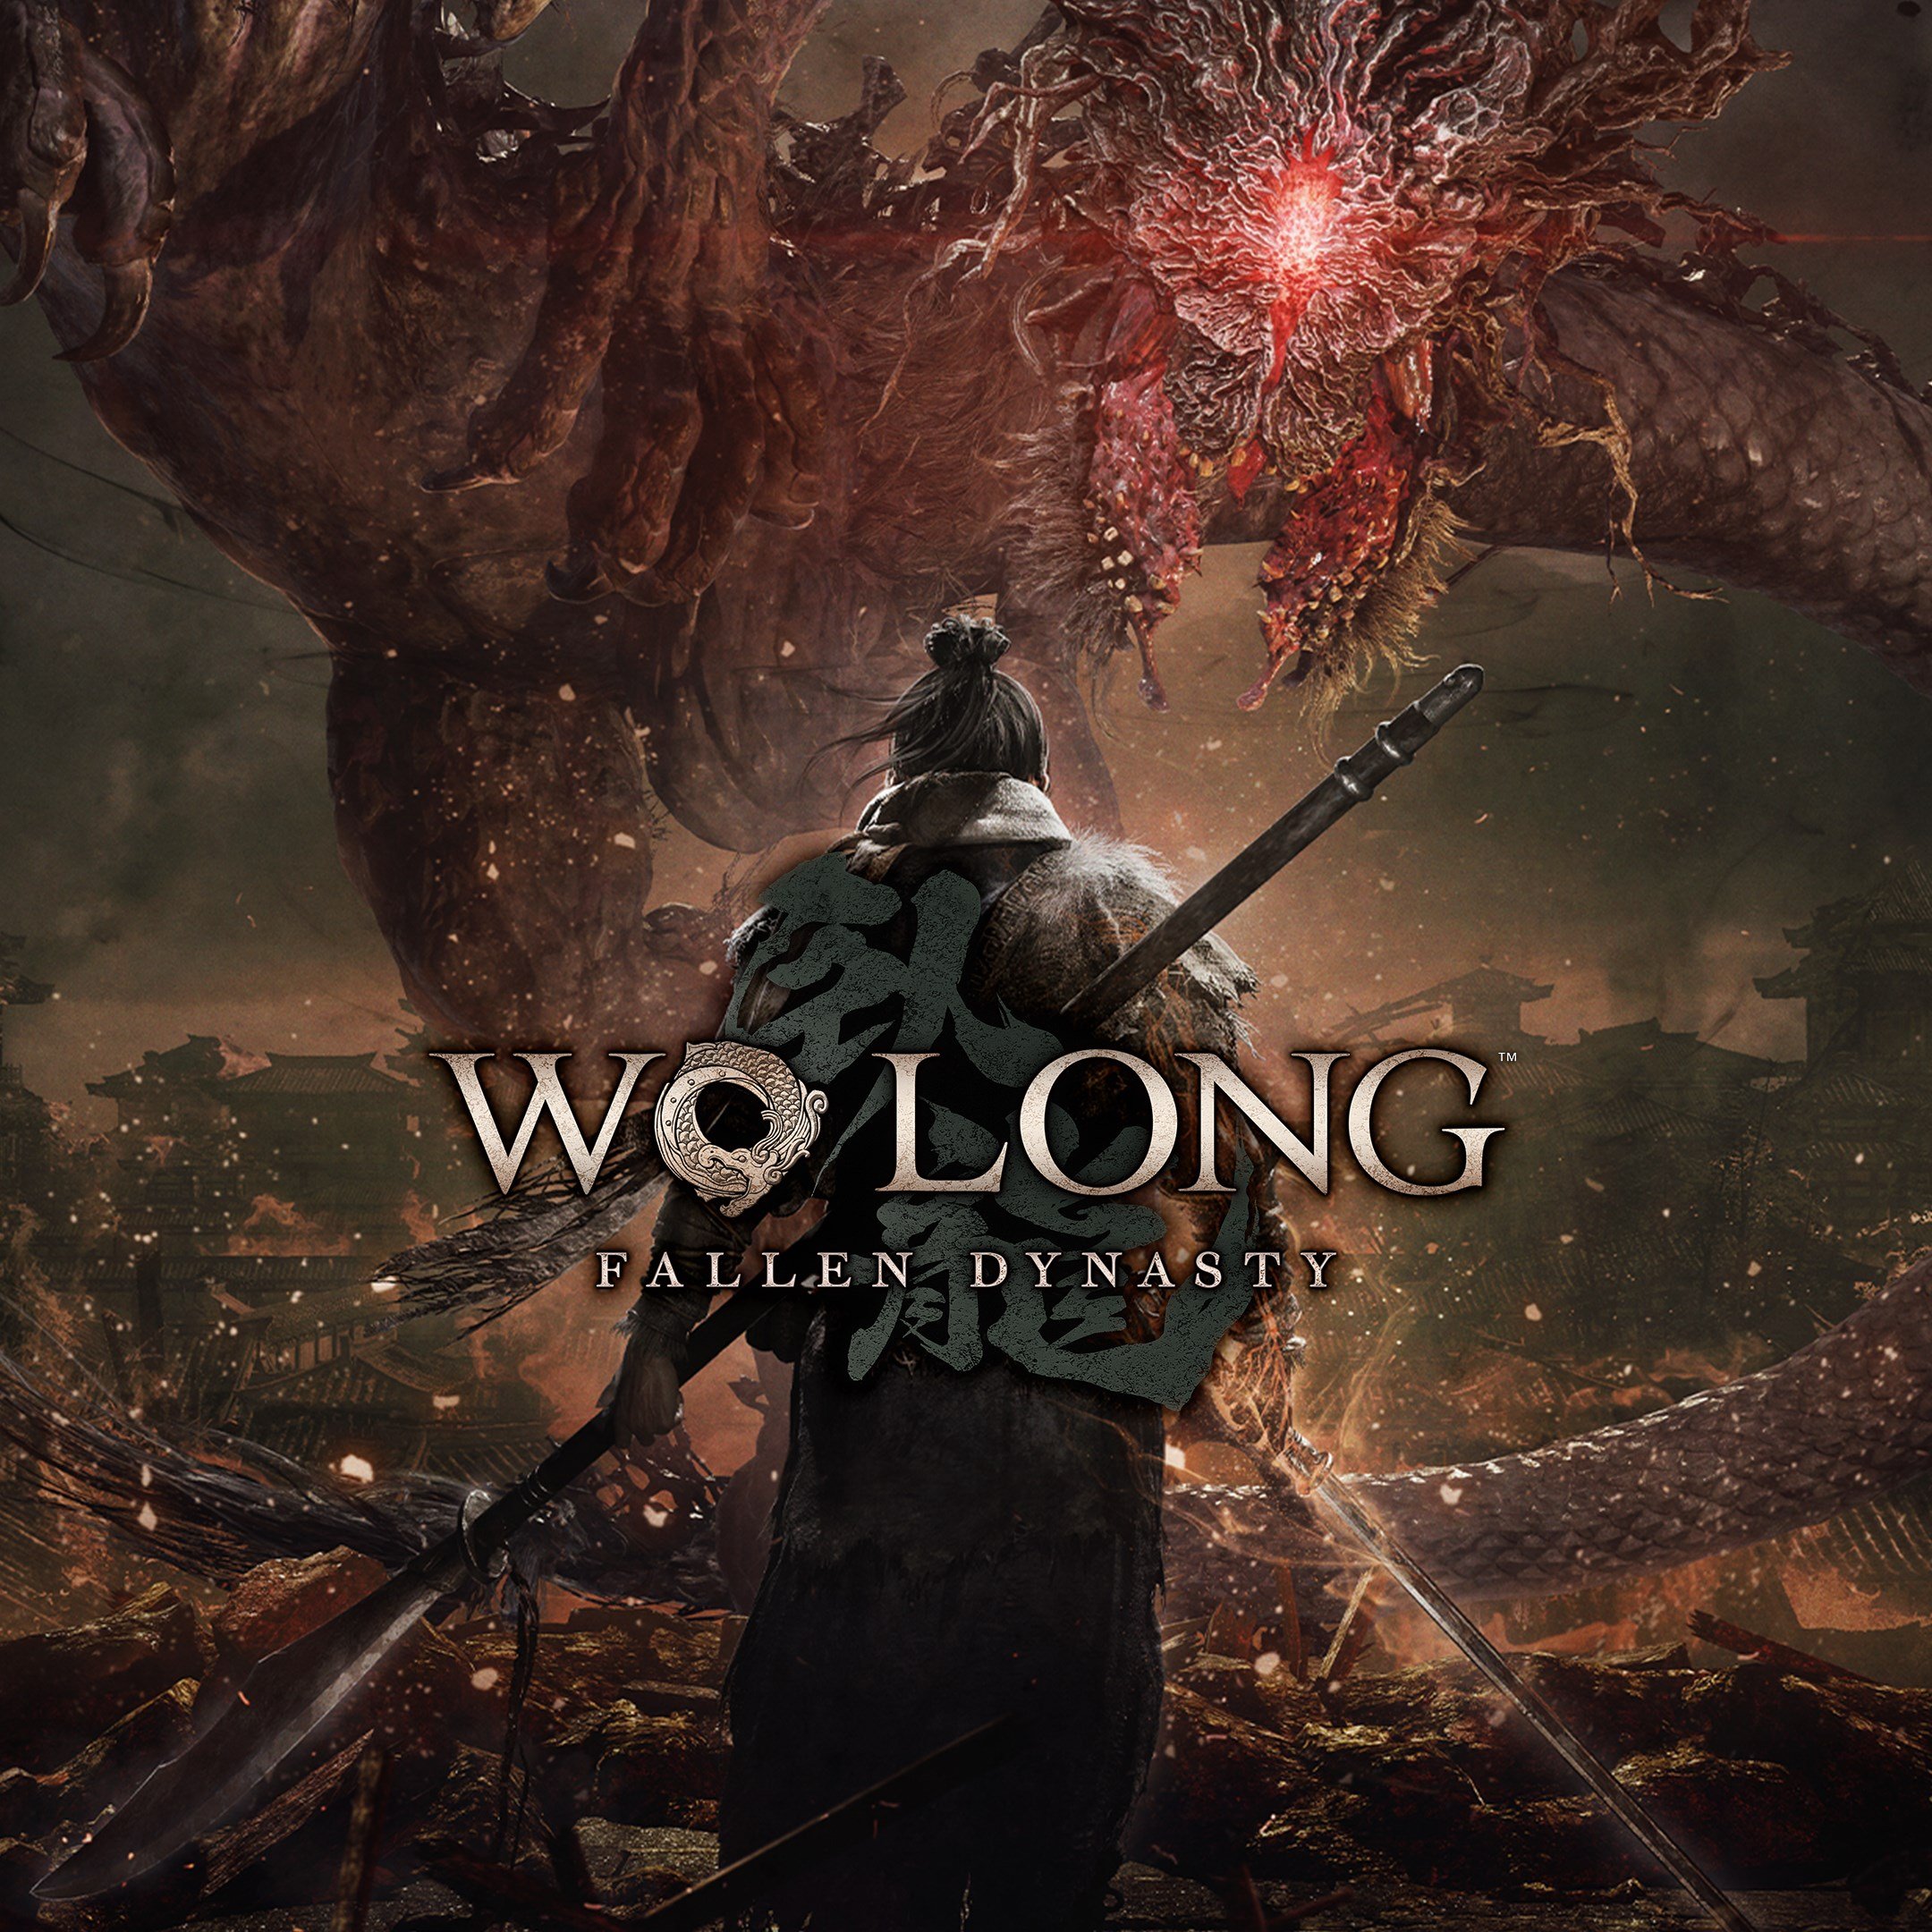
About game
Show more
Release date
2023.03.03 (Xbox)
2023.03.03. (Original)
Genre
Role-playing (RPG)AdventureDeveloper
Team NINJAPublisher
Koei Tecmo GamesEngine
Katana EngineMode
Single PlayerMultiplayerCo-operativePerspective
Third PersonTheme
ActionFantasyMore tags
Dark Fantasy
Platform ID
1690524168


Looking to track your own stats?
Create a PlayTracker account for free, link your other accounts like XBOX, and track your achievements, playtime, and stats in Wo Long: Fallen Dynasty and all other games you play!
Lens audience segmentation
Yearly achievement activity
Monthly achievement activity
Purchase a premium subscription to get access to this graph and more.
New users over time
Purchase a premium subscription to get access to this graph and more.
User interaction
User personalities
Veteran Collector
Has a huge library of games.
74% personality strength
Opposite personality: Fresh Recruit
Opposite personality: Fresh Recruit
Niche Dweller
Sticks to a specific type of game.
63% personality strength
Opposite personality: Genre Nomad
Opposite personality: Genre Nomad
Deep Diver
Plays a few games a lot.
62% personality strength
Opposite personality: Intrepid Explorer
Opposite personality: Intrepid Explorer
Platform Specialist
Sticks to one platform.
62% personality strength
Opposite personality: Device Juggler
Opposite personality: Device Juggler